Our mission

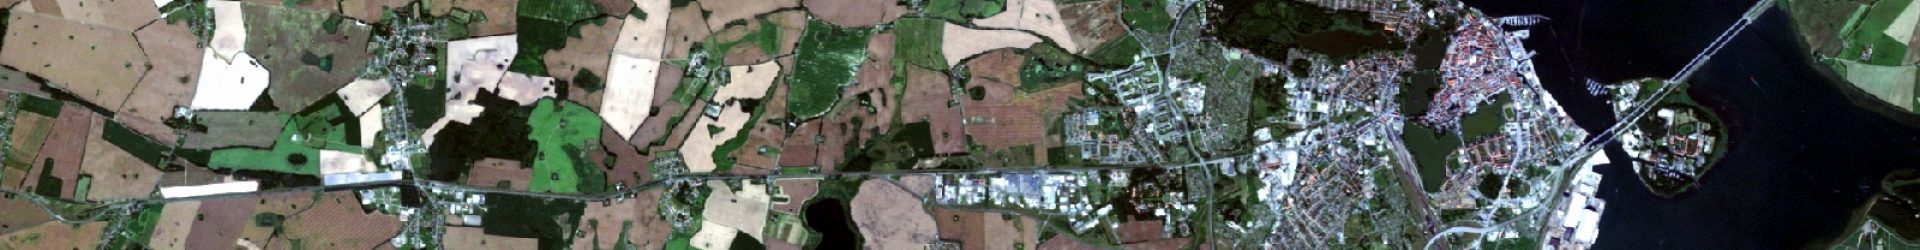
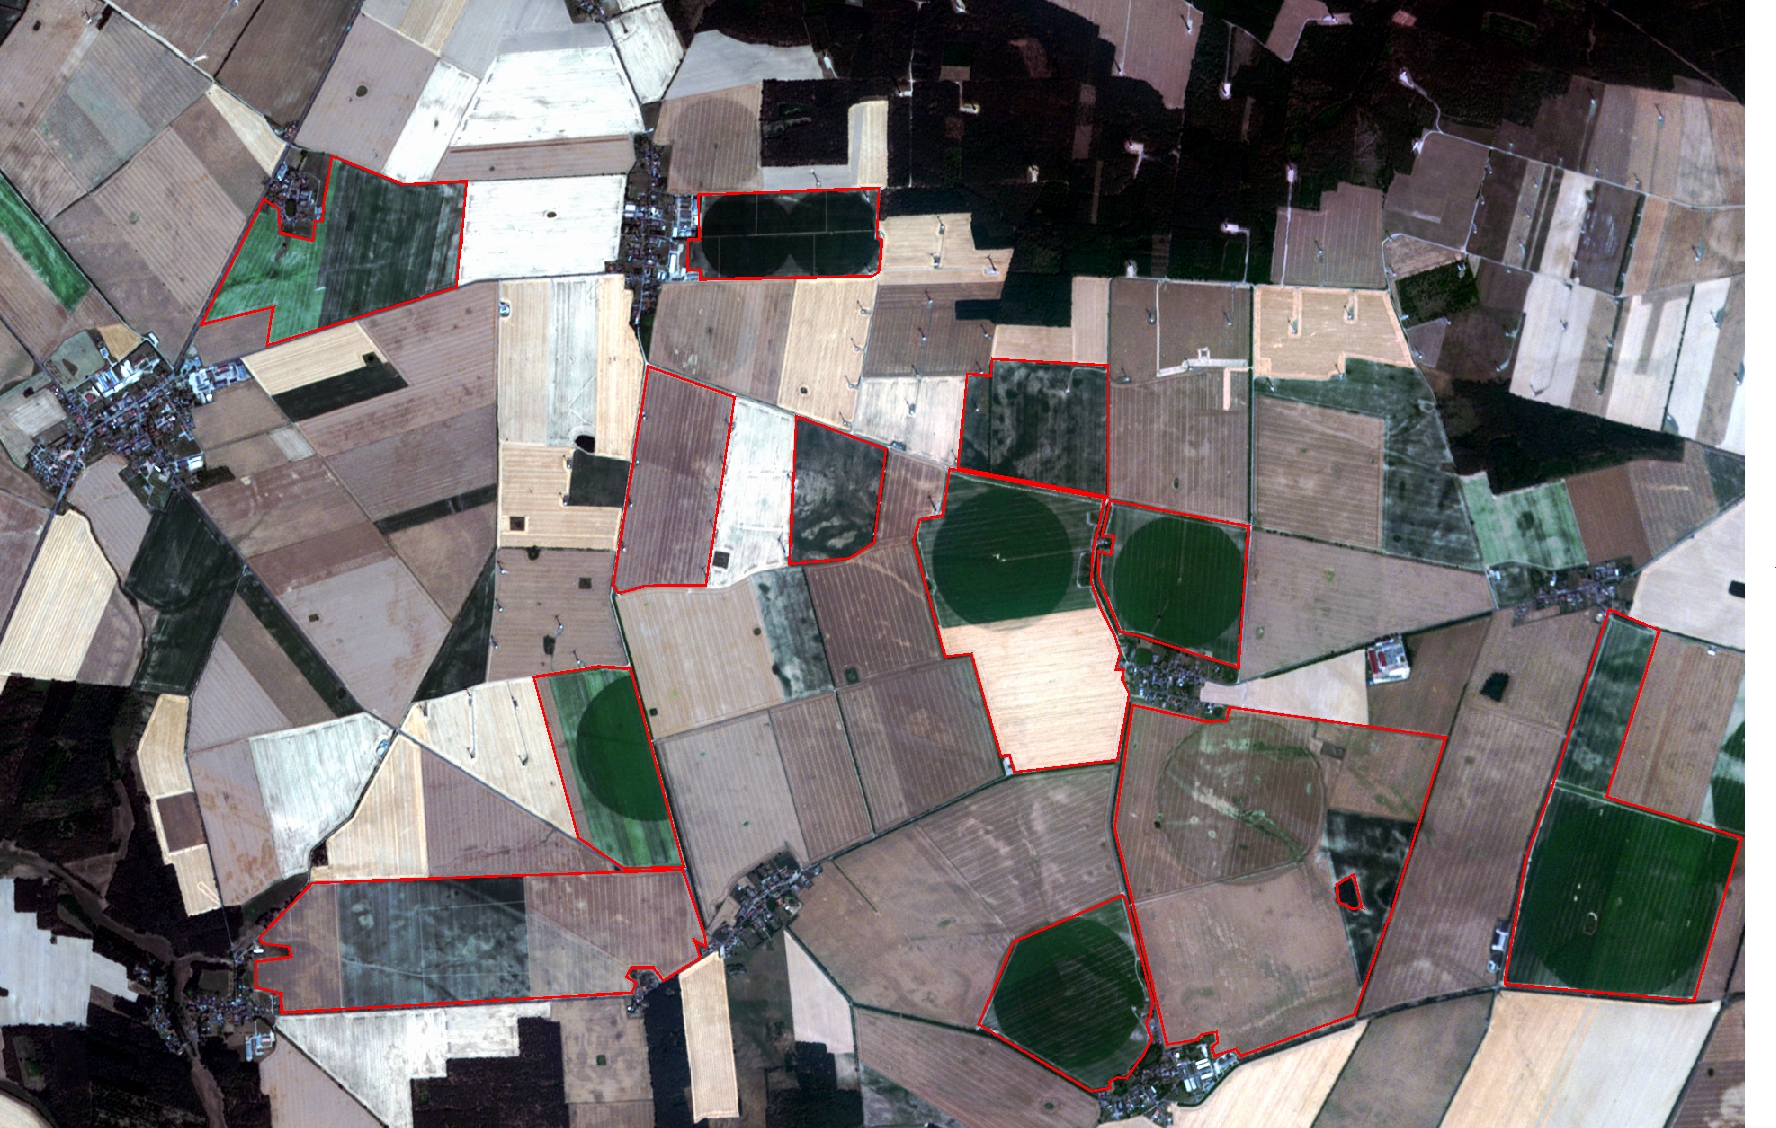
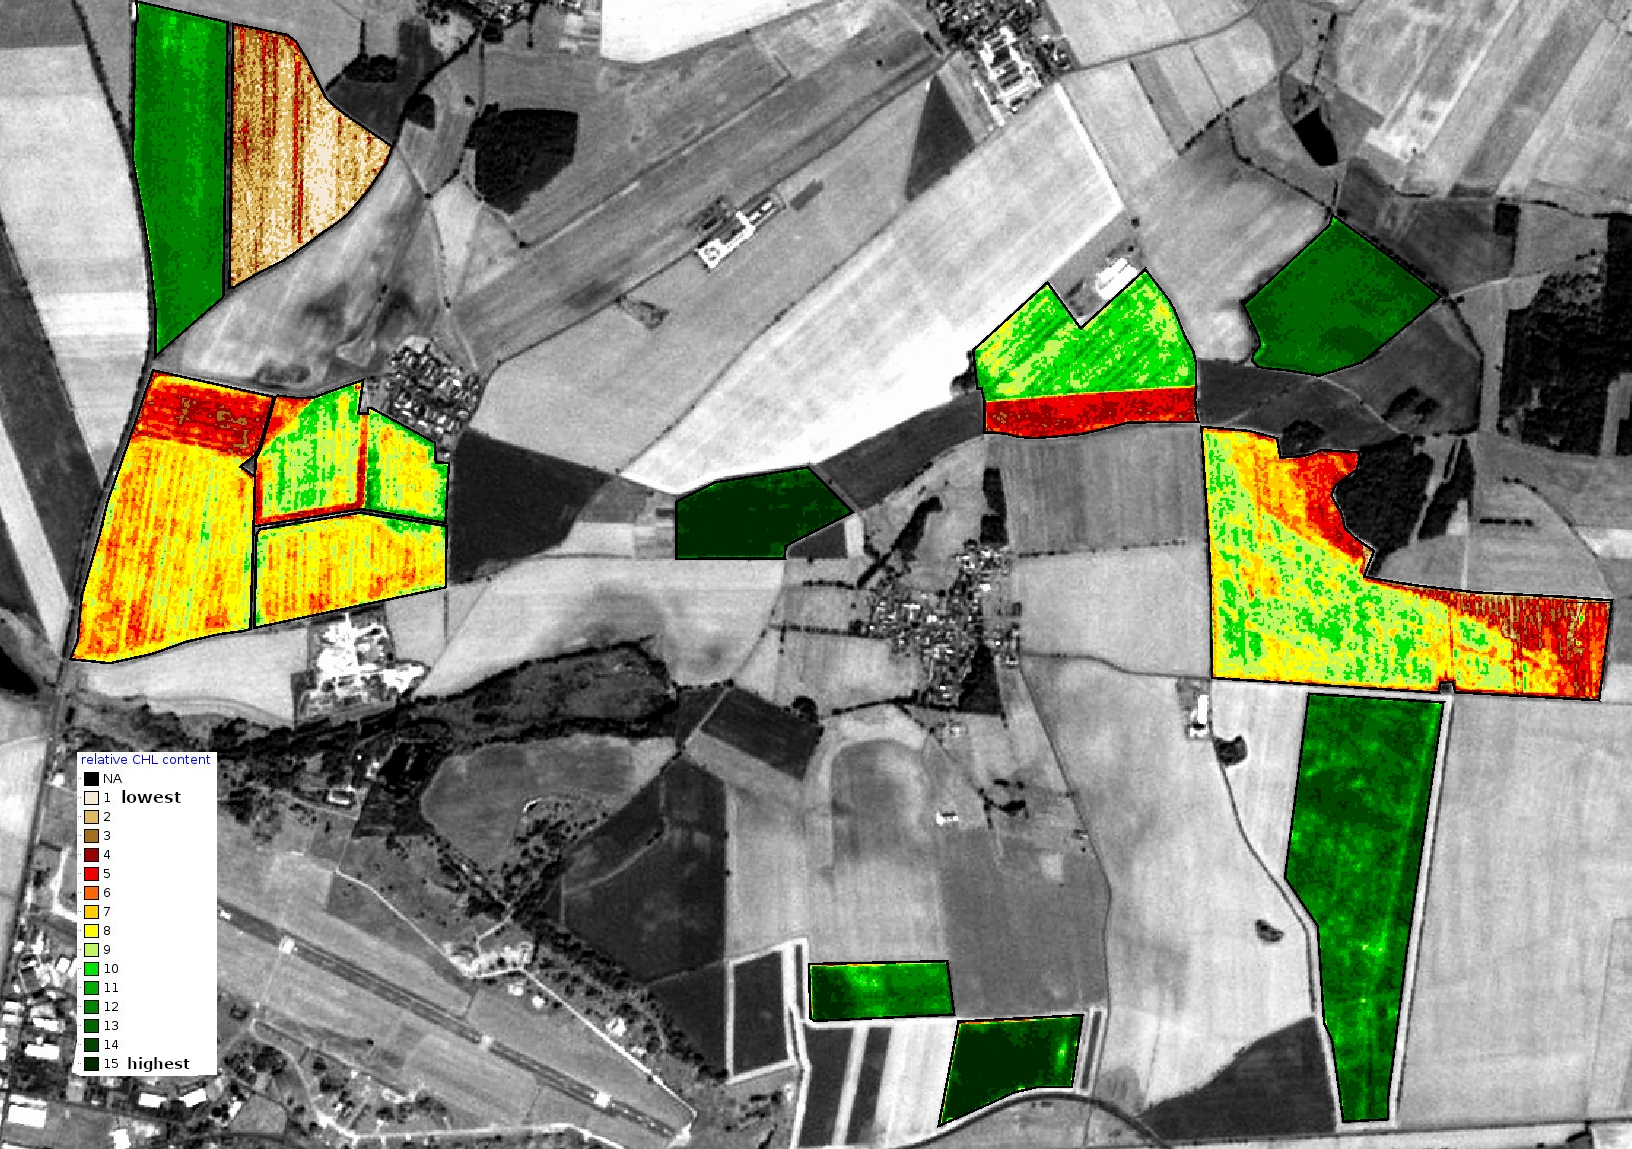
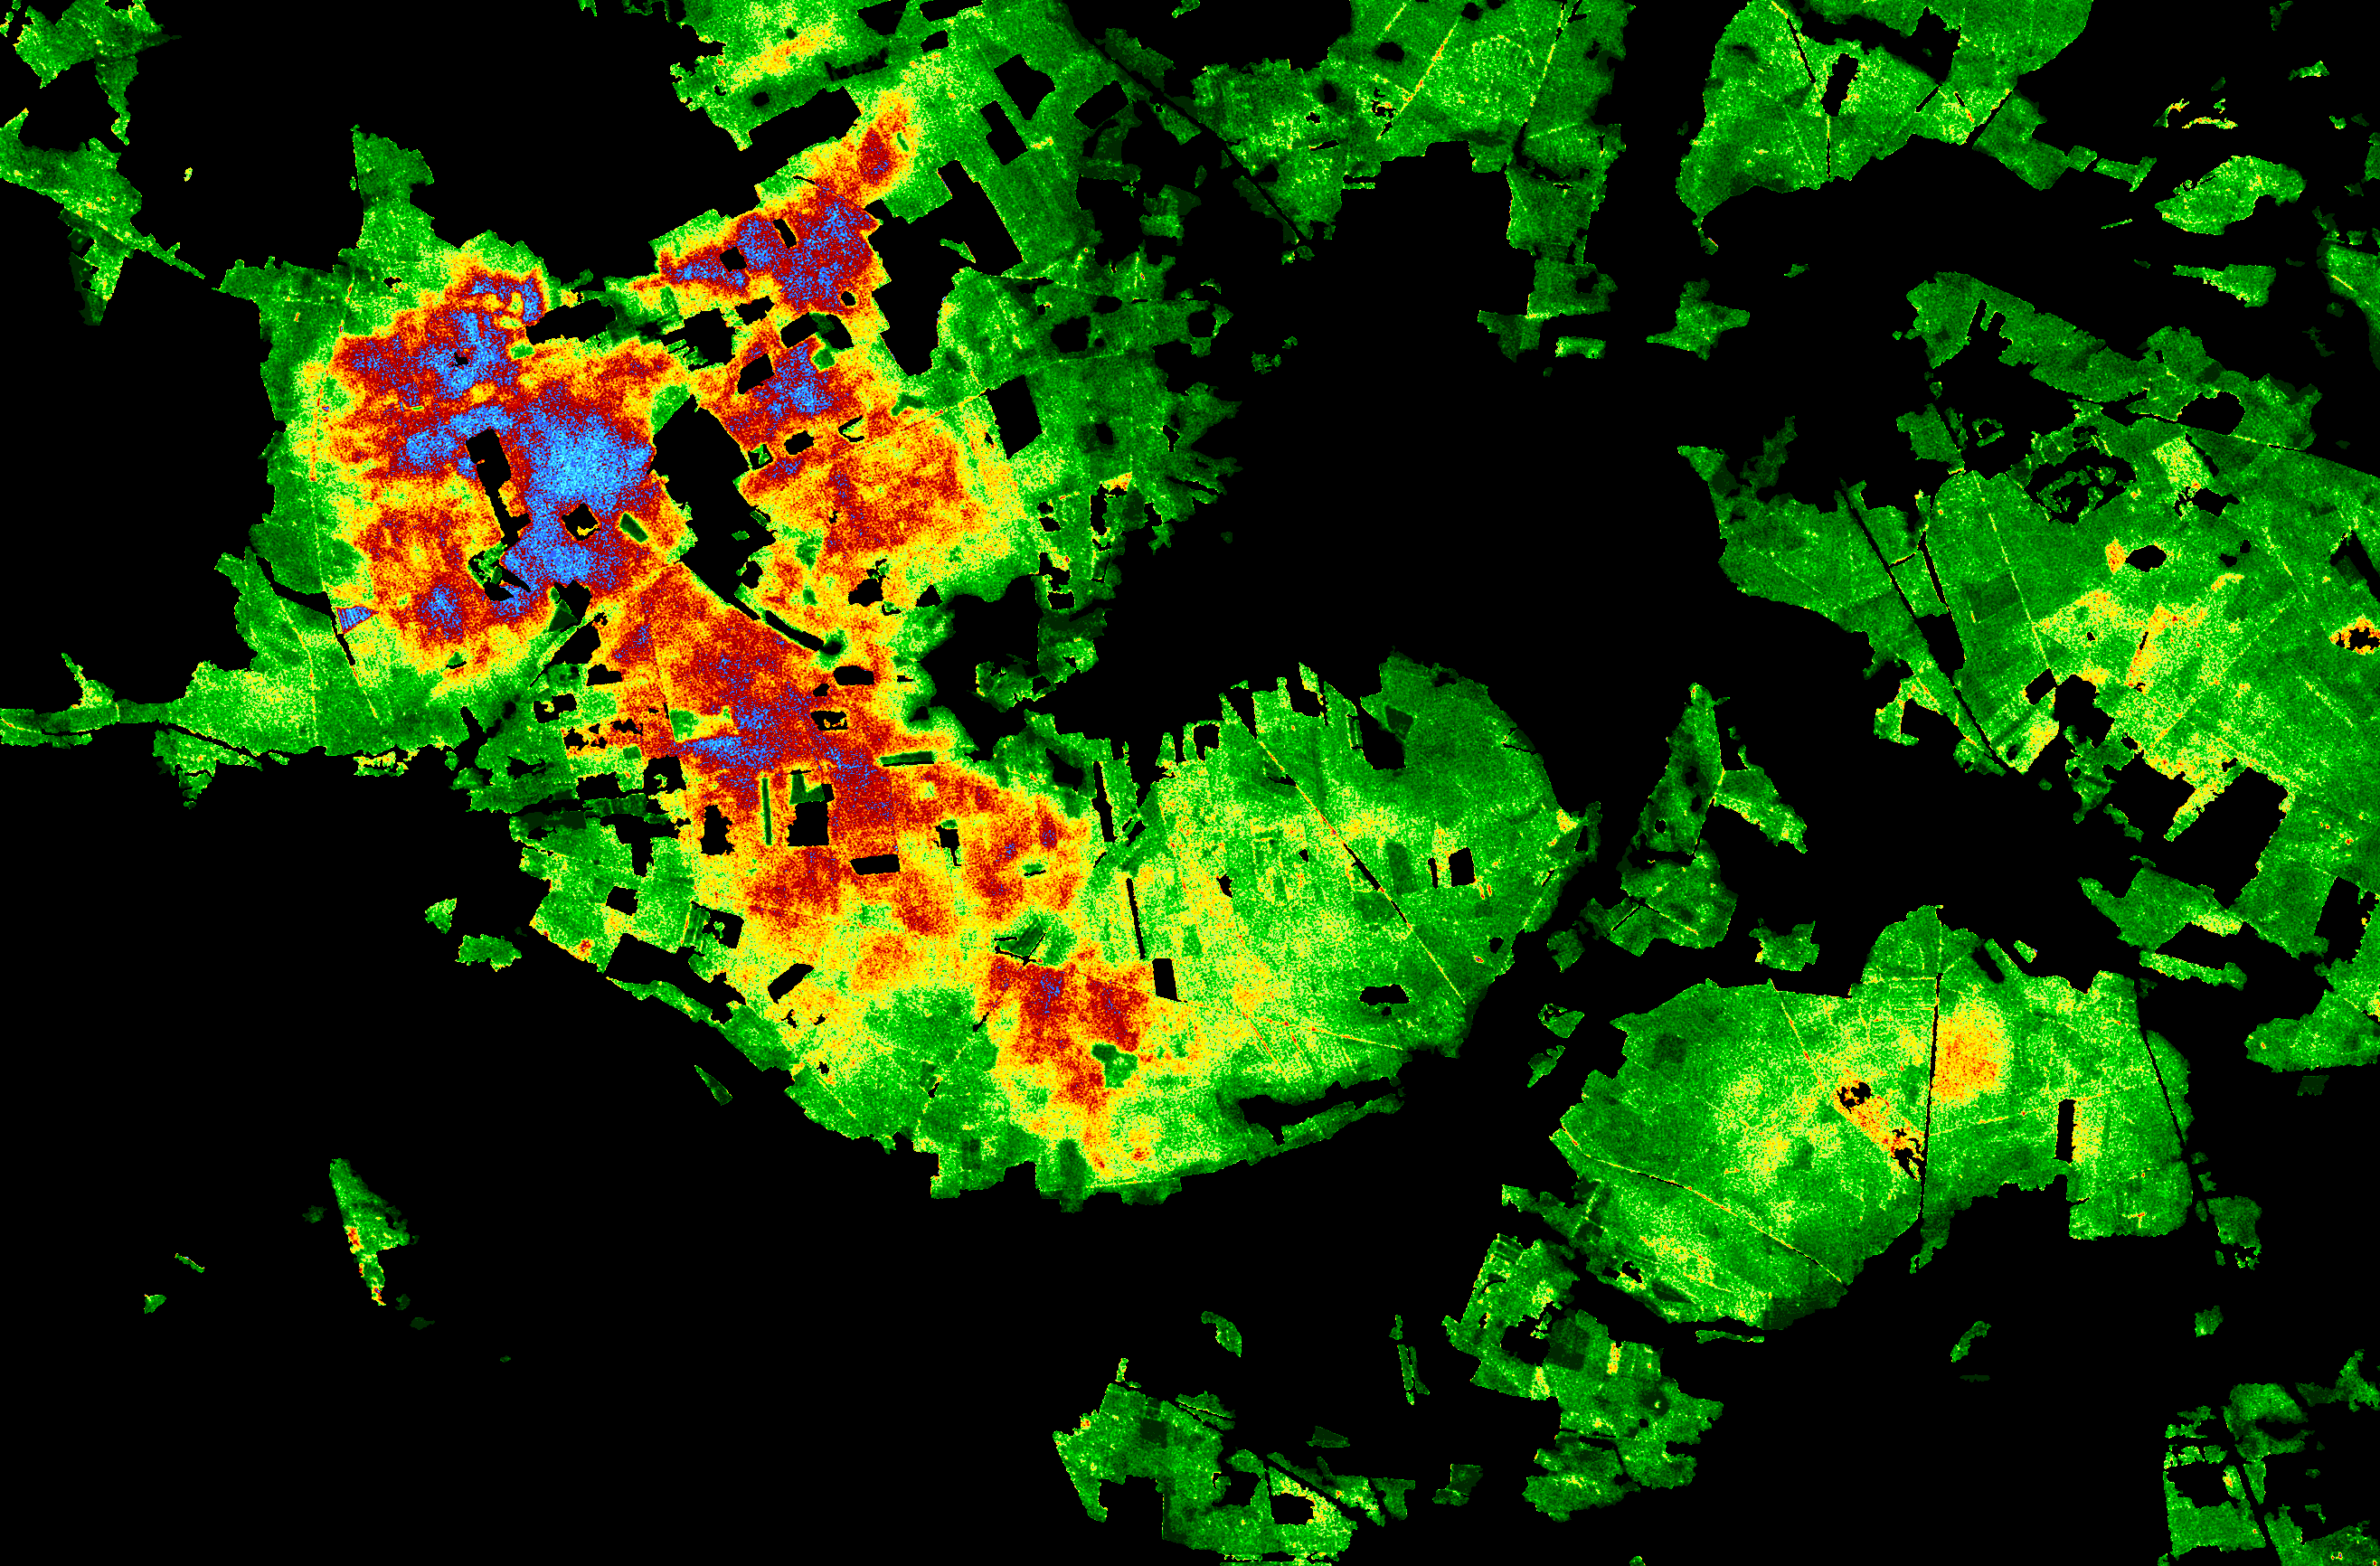
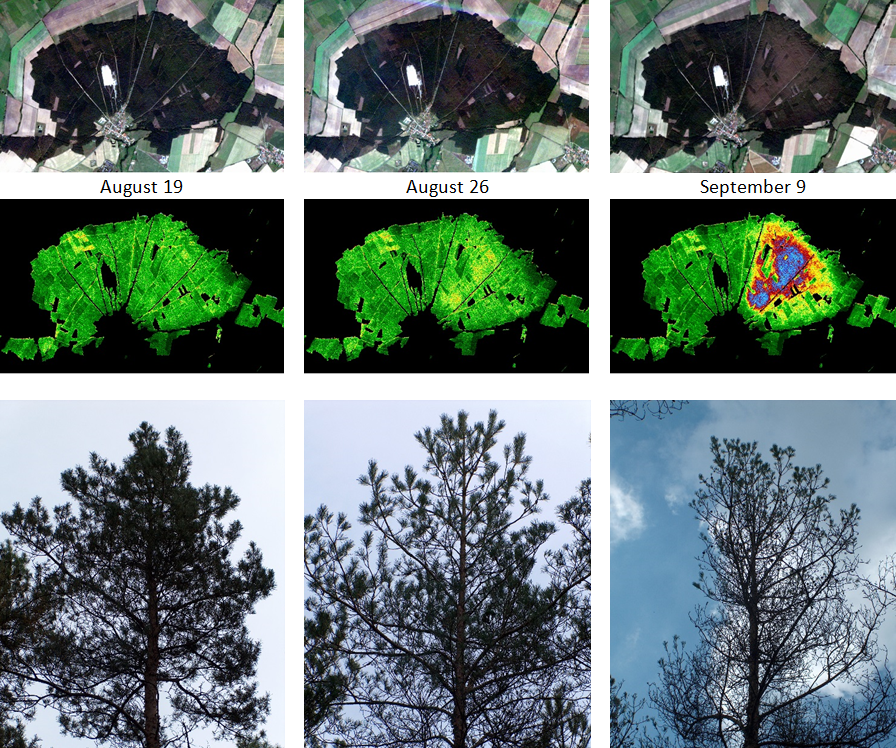
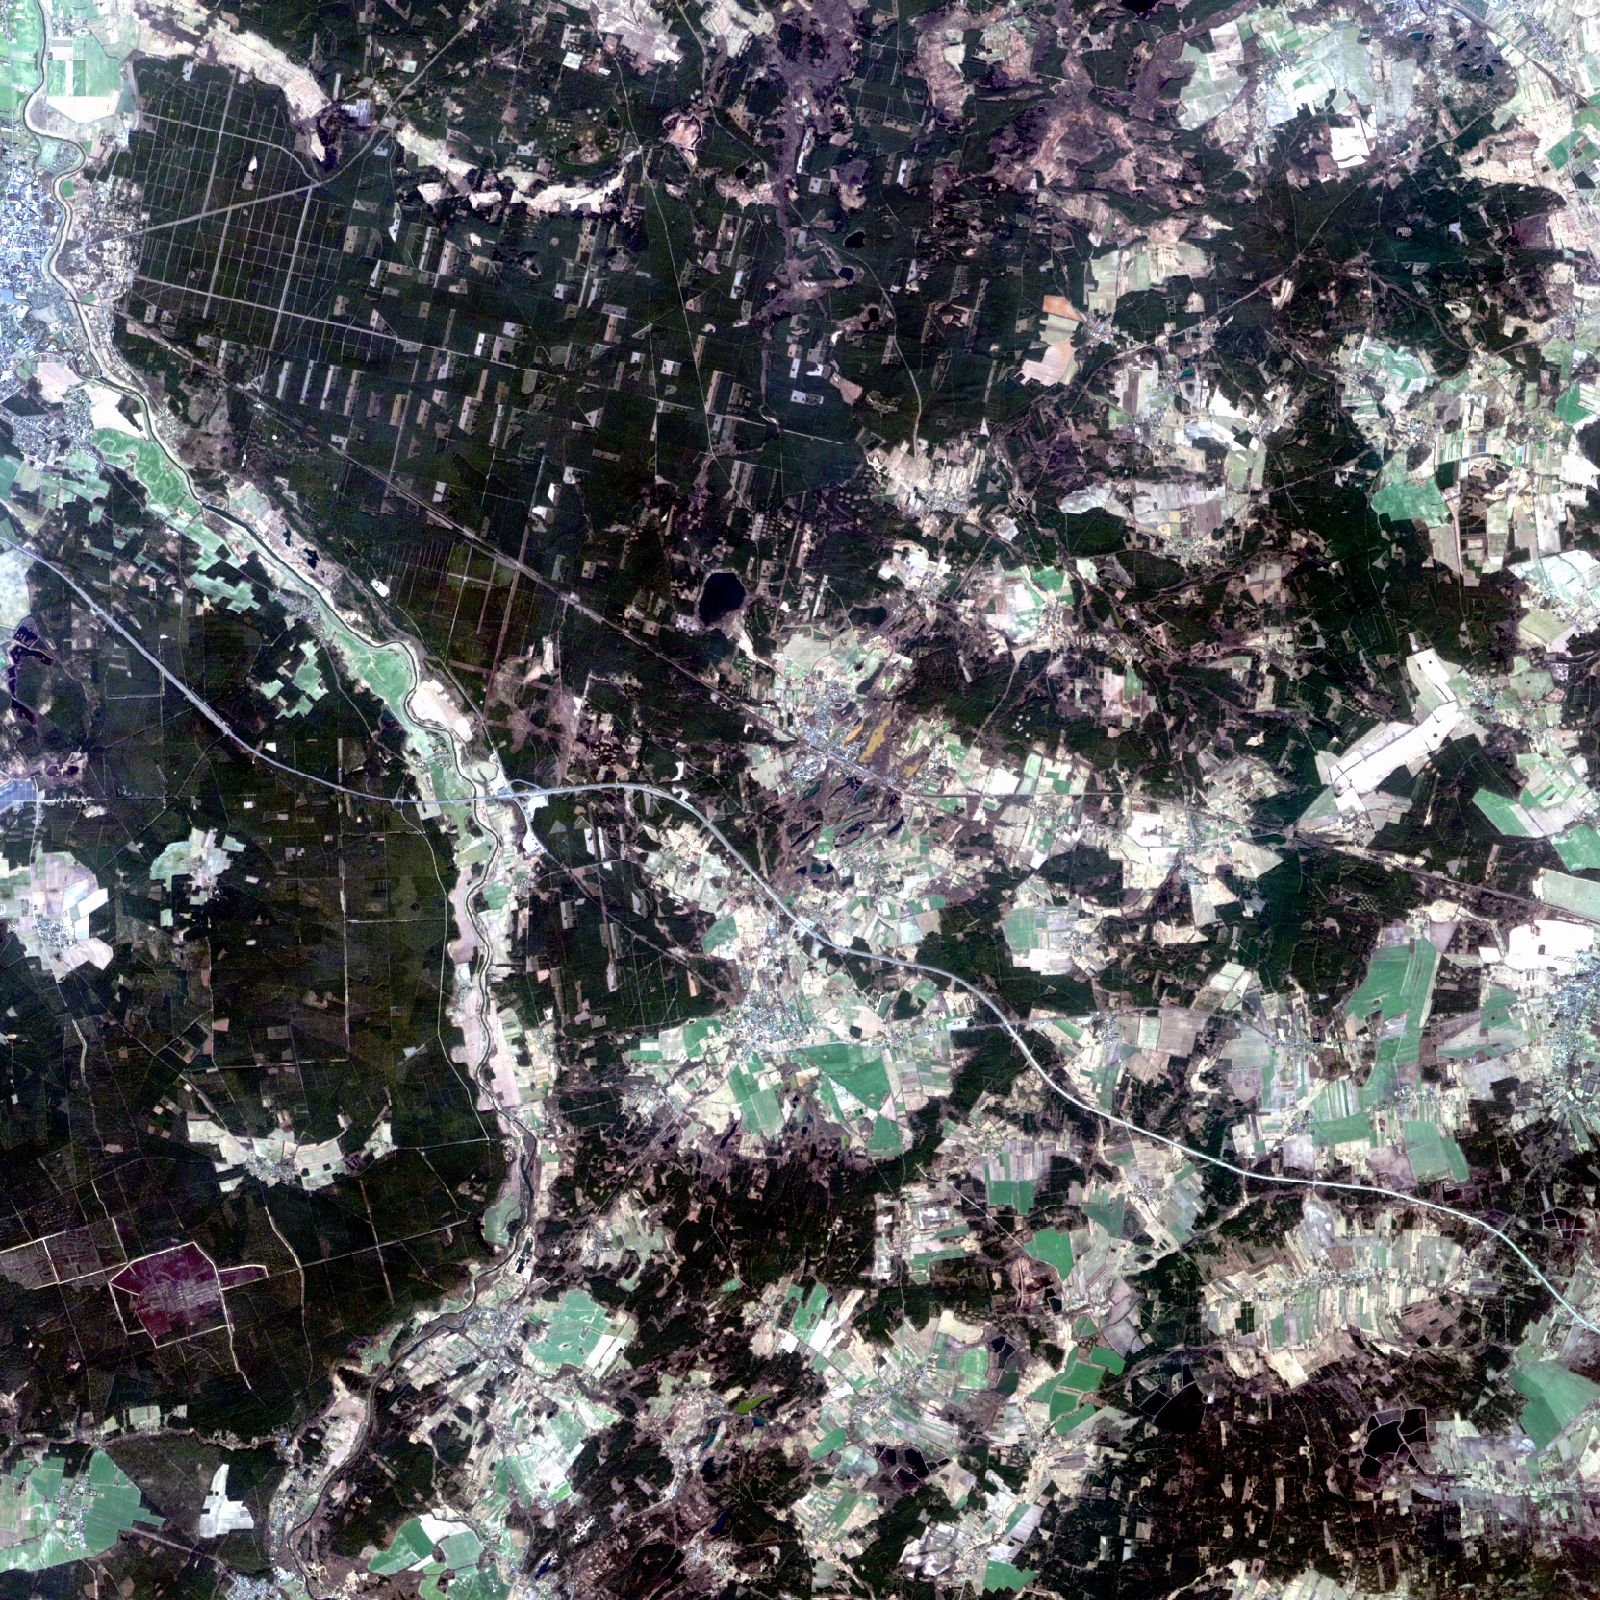
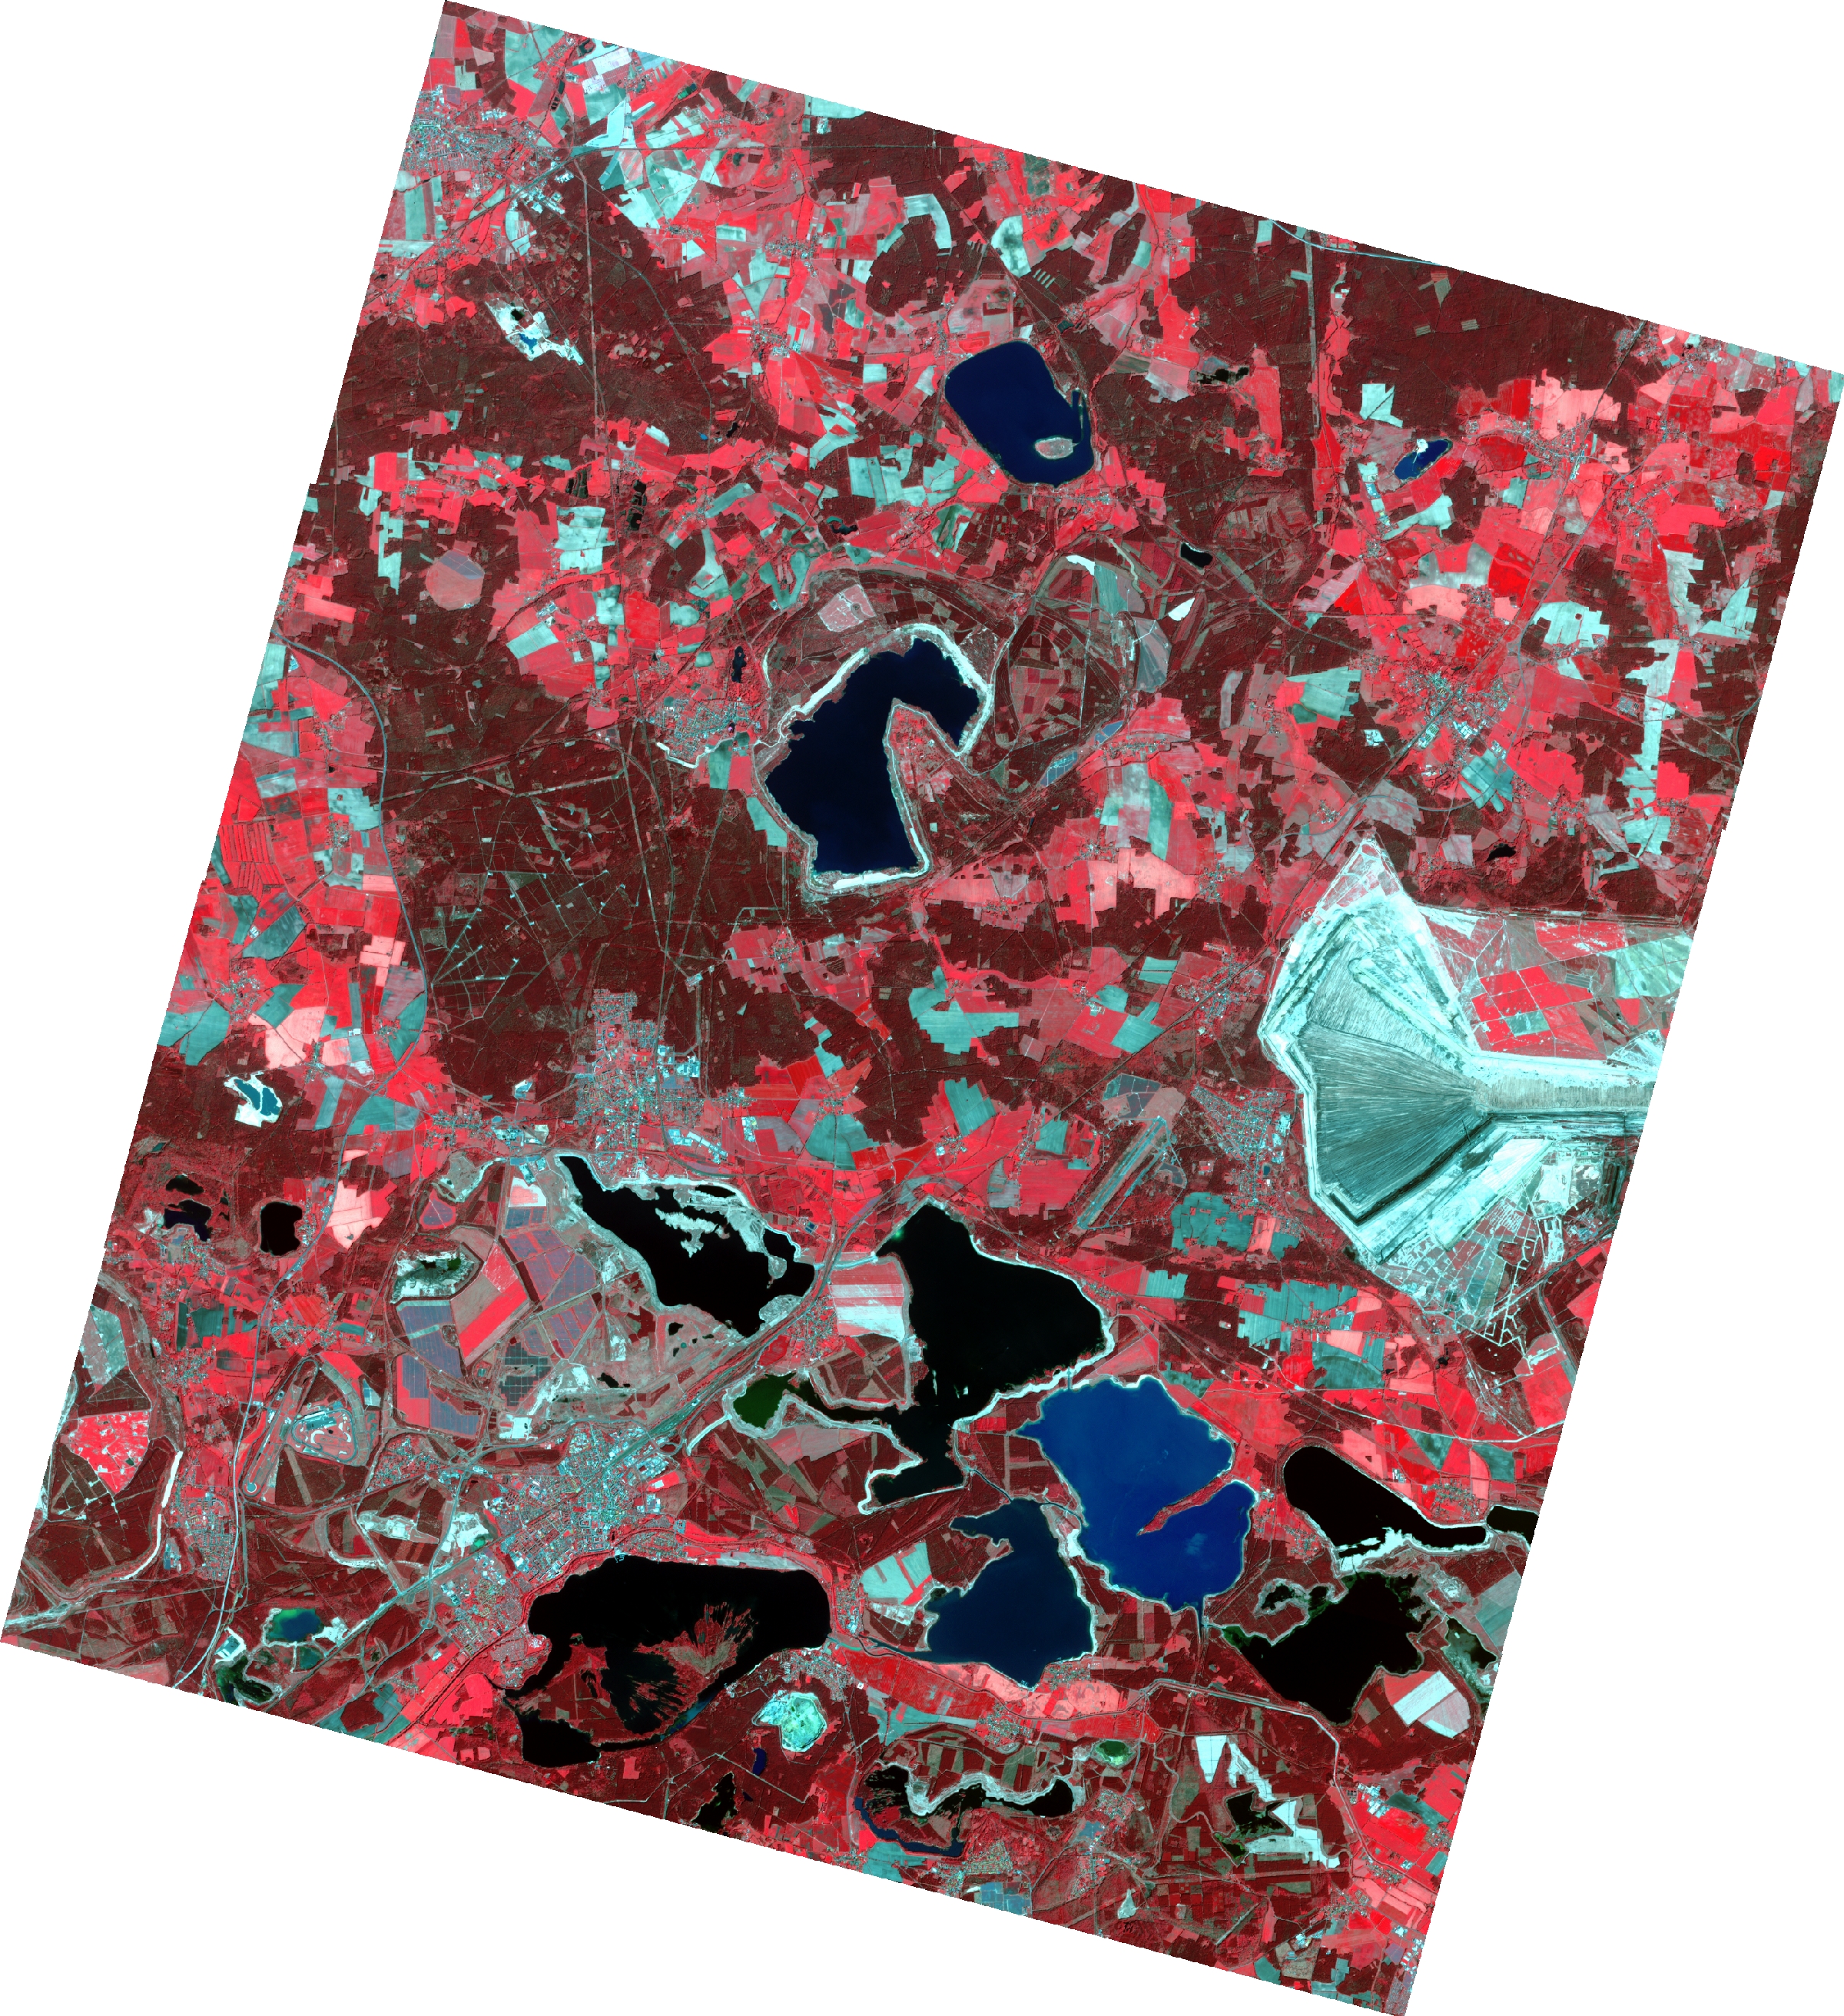
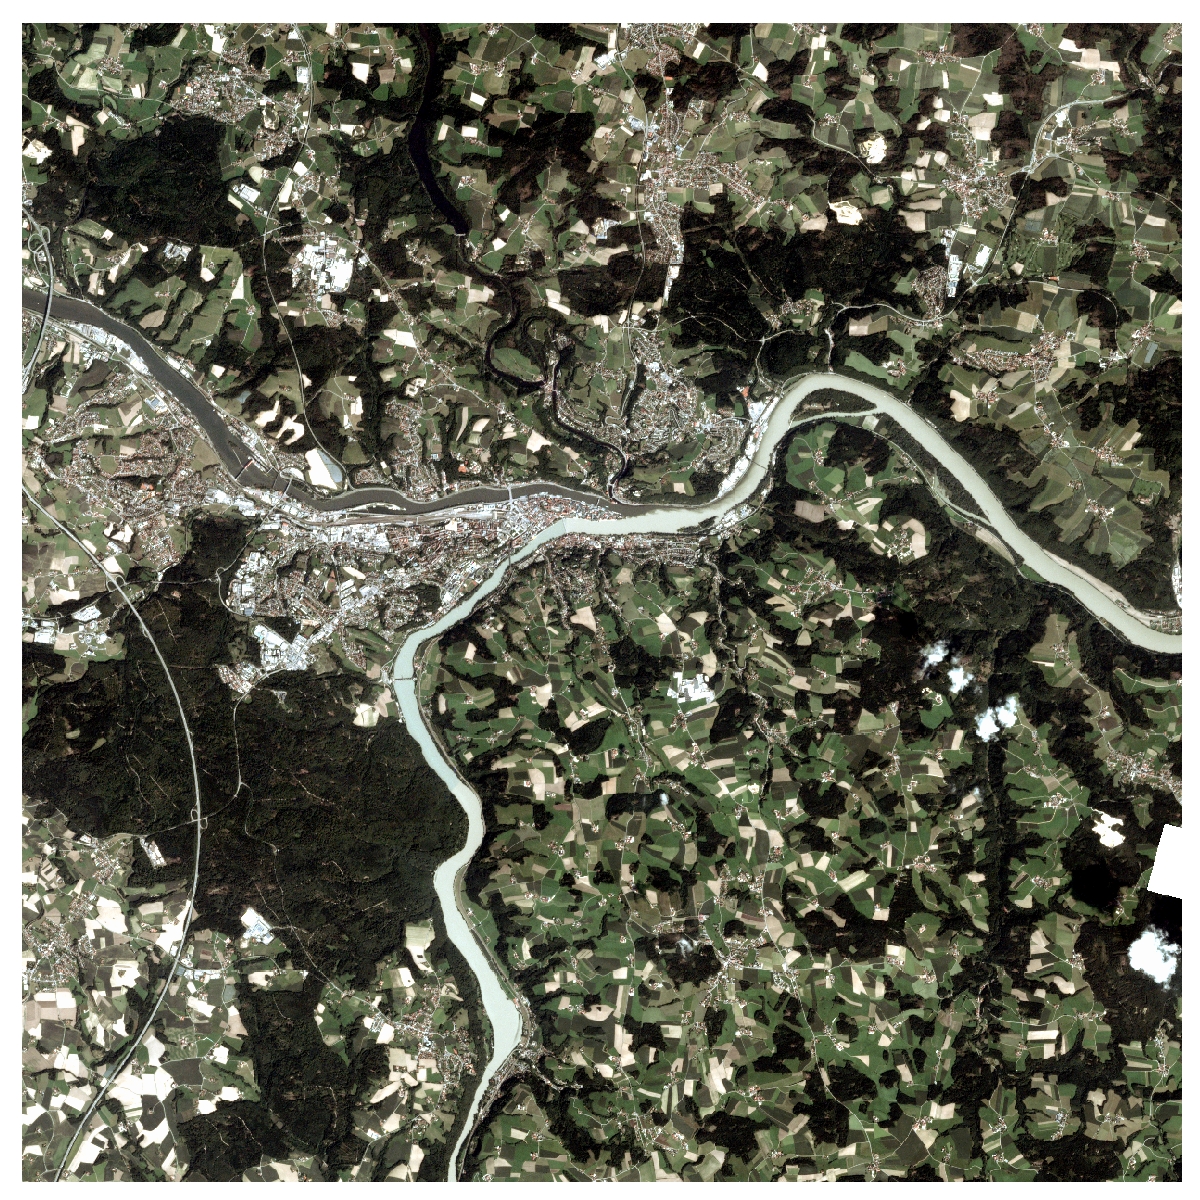
EOGREEN ANALYTICS is a globally active geospatial information service provider. Using different sources of satellite earth observation data, such as RapidEye, PlanetScope, Sentinel 2, or aerial imagery, we provide you on your request with analytic products extracted from the image data. The analytic products (digital raster and vector maps, reports) help make your daily business and tasks more effective and efficient by providing new insights, answers, documentations, and by saving your precious time. We commit to high quality, timely delivery, and a well coordinated customer service.

The founder can look back to a work life history of more than 10 years at RapidEye, BlackBridge, and Planet Labs.

Do not hesitate to contact us.

Crop Damage Maps

Crop damages and crop health – We deliver relevant spatial information over large areas, rapidly.

Extreme weather situations, such as windstorms, extreme precipitation, or extreme drought periods, usually lead to crop damages. Pests and diseases can impair crop vitality noticeably. By utilizing the advantages of PlanetScope or RapidEye imagery and by using application case specific algorithms we map for our customers the extents and magnitude of damages at high resolution.

Crop damage maps are useful in cases of:

  • devastating windstorms
  • extreme precipitation (rain, hail)
  • mass infestations of defoliating insects
  • epidemic fungal or bacterial diseases such as Fusarium wilt, Goss’s wilt
  • severe drought stress
  • fires

The derived digital maps are relevant for:

  • farmers
    • overview and reporting of the situation
    • action planning
    • more targeted application of plant protecting agents
  • crop insurances (damage verification and estimation)

If you like to use our services, just get in touch with us: contact.

Green Ground Cover Maps

Enhance your site-specific crop management (SSCM). Monitor growth and key growth stages of your crops.

Green Groundcover Maps (GGC%-Maps) show the percentage of green vegetation cover of your crop field in 10 percent classes. They are typically applied in Precision Agriculture. In contrast to the widely used NDVI maps, the advantage of these maps is the more specific information content (specific GGC%-class vs. unspecific NDVI-value). The Ground Cover calculation method is based on scientific findings.

PlanetScope, 2017-08-30, true color, with selected field boundaries
Ground Cover, calculated for selected fields


RapidEye, 2018-07-04. true color, selected field boundaries
Ground Cover, calculated for selected fields


If you like to use our services, just get in touch with us: contact.

Chlorophyll Maps

Be more competitive. Benefit from up-to-date satellite remote sensing technologies for Precision Agriculture.

  • estimate and visualize the relative canopy chlorophyll content of crops and its within field variations
  • apply fertilizers more specifically and precisely
  • get valuable spatial information input for productivity and yield modeling
  • estimate the optimum point of harvest
RapidEye, true color
RapidEye, RedEdge band, relative chlorophyll content shown for selected fields

Our Chlorophyll Maps show the relative chlorophyll content of crops and its within field variations. This is helpful for a more precise application of fertilizers. Weekly updated time series of chlorophyll maps can be used as input for productivity and yield modeling. Moreover, the time series are helpful to determine the approximate optimum point of harvest.

Various scientific remote sensing related publications have proven the usefulness of the RedEdge spectral band for mapping relative chlorophyll content of vegetation canopies when used in the Normalised Difference RedEdge Index (NDRE). RapidEye and Sentinel 2 satellites carry multi-spectral camera systems equipped with RedEdge spectral bands (Rapideye: 5m pixel size, Sentinel 2: 20m pixel size).


If you like to use our services, just get in touch with us: contact.

Forest Disturbance Maps

Forest health issues? Forest damages? We can help you to better manage forest disturbances.

Forest Vitality Index 2018-04-09

Based on our unique Forest Vitality & Change Monitoring (FV&CM) service we provide you on your request with a set of analytic products (digital raster and vector maps), which can be applied to the following types of forest disturbances:

  • Mass outbreaks of defoliating insects (e.g. Gypsy moth, Pine beauty moth, Western spruce budworm, Black arches)
  • Mass outbreaks of wood and bark breeding insects (e.g. bark beetles, wood wasps, borers)
  • Epidemic diseases (e.g. different types of root rot)
  • Sustained drought periods
  • Windstorms
  • Ice-, hail- , snow storms
  • Forest fires

    Forest Vitality Index 2018-07-03, after mixed infestation by Black arches and European pine moth

Further service application cases are:

  • Mapping of clear cuts
  • Monitoring of illegal logging activities
  • Proof of forestry operations (Thinning)
  • Supporting Forest Degradation and Deforestation Monitoring for REDD+ MRV


If you like to use our services or want to know more, just get in touch with us: contact.


With time series, early detection of defoliator outbreaks is possible. This example shows a sequence of a pine saw fly outbreak.

Updated Forest Cover Maps

Keep your forest cover information up-to-date.

Tree cover of managed forests is exposed to frequent changes due to e.g. logging, forest fires or windstorms. Using the most recent RapidEye or PlanetScope satellite imagery, we produce for your area of interest accurate forest cover maps at a minimum mapping unit of 0.1 hectares.  Click the sample images to enlarge.

RapidEye, 2018-04-10, true color
2018-04-10, forest cover (pine)
PlanetScope, 2017-05-11, Color Infrared
2017-05-11, forest cover (green), all tree species


If you like to use our services or want to know more, just get in touch with us: contact.

Analysis ready multitemporal data sets

Do not waste time with data-preprocessing. We prepare analysis ready multitemporal data sets for you.

Multi-temporal satellite image data sets and dense image time series offer a realm of image analysis and information extraction possibilities. Change processes can be traced at high frequency. We prepare these data sets for you. What you get is analysis ready image stacks or, if desired, data cubes of indices such as NDVI time-series. Our service includes:

  • selection of best images from data provider
  • image co-registration
  • top of atmosphere correction (for RapidEye ond PlanetScope); for Sentinel, BOA corrected images will be used
  • radiometric normalisation of the time series components
  • index calculation, if desired (e.g. NDVI), and stacking

If you like to use our services or want to know more, just get in touch with us: contact.

Custom Image Mosaics

Do you need high-quality image mosaics?

Fully automated mosaicking of imagery is fast and scalable, however, high quality cannot always be guaranteed.

In contrast, our mosaicking approch is based on:

  • supervised input image quality assessment
  • top of atmosphere correction (for RapidEye ond PlanetScope); for Sentinel, BOA corrected images will be used
  • cloud and cloud shadow replacement from multi-temporal imagery (dense time series), if desired
  • supervised mosaicking process
  • supervised mosaic quality assessment

With this approach, we are able to deliver image mosaics of highest quality possible.

If you like to use our services or want to know more, just get in touch with us: contact.

Emergency and Disaster Monitoring

Enhance your actionability in emergency and disaster situations.

With our satellite-aided disaster monitoring service we assist relevant institutions and organizations in situations of catastrophic events, such as:

  • flooding
  • windstorms
  • wild fires
  • landslides
  • oil spills
  • pollution of water bodies due to chemical plant accidents or accidents in mining areas

The delivered analytic maps are a vital input for:

  • reporting
  • disaster management planning

If you like to use our services or want to know more, just get in touch with us: contact.

Example: Hurricane of Passau (Germany), 18th August 2017

YouTube Video: here

18th of August 2017, a hurricane swept through the landscape around the German city Passau leaving behind a trace of devastation in the sourrounding forests. Since the PlanetScope satellites image the globe’s land masses every day, the probability of having cloudfree images from shortly before and shortly after a hurricane available for impact analysis is high. In this case, damage mapping results were available within five days after the hurricane.

PlanetScope, 2018-08-14
PlanetScope, 2018-08-23
hurricane impact analysis, forest damage areas


Continue reading“Emergency and Disaster Monitoring”

Detection of Illegal Activities

In many parts of the world, illegal logging, illegal mining, and general illegal conversion of forest to other uses (e.g. agriculture) constitutes a serious threat to:

  • areas protected in accordance with the IUCN categories
  • natural resources owned and managed by public or private institutions
  • indigenous and community-owned lands
  • high conservation value areas

We help governmental institutions and NGOs detect and report such illegal activities. The satellite images and derived analytic maps:

  • are vitally relevant for reporting
  • serve as certain means of evidence for lawsuits

If you like to use our services or want to know more, just get in touch with us: contact.